Linking Short Rain Events to Temperature: Understanding Extreme Weather

As we saw in my last post the concerning events in the last 18-years from the Tel Aviv Coast gaouge, we will see how the relationship between temperature fluctuations and extreme short rain events with high precipitation is paramount in the context of contemporary climate research. As our planet grapples with the ramifications of climate change, the frequency and intensity of extreme weather events have become increasingly pronounced, posing significant challenges to both human societies and natural ecosystems.
In recent years, the scientific community has observed a surge in such events, ranging from sudden deluges causing flash floods to localized intense rain showers, often occurring within a remarkably short span of time. The last 18 years, spanning from 2005 to 2023, have witnessed a comprehensive collection of meteorological data at a local weather station, capturing the nuances of rain intensity and temperature variations.
This study delves into the intriguing interplay between rising temperatures and rain intensity, aiming to unravel the potential impact of climate change on hydrology events.
Climate change, manifests itself through shifts in temperature, precipitation patterns, and the frequency of extreme weather events. As we navigate an era of heightened environmental awareness, the need to decipher the specific consequences of these changes on regional hydrology becomes increasingly urgent. In this context, our investigation focuses on the correlation between average temperature and rain intensity, leveraging a rich dataset meticulously recorded over the past 18 years. The central question guiding our exploration is whether the observed rise in average temperature correlates with discernible changes in rain intensity.
Methodology
Data Source
The meteorological data for this study were retrieved from the Israel Meteorological Service through their API, using a designated key for data access. The dataset spans 18 years, from the 1st of September 2005 to the 1st of September 2023, providing a comprehensive temporal perspective on local climate dynamics. This time frame, aligning with the winter-to-winter seasons, ensures the inclusion of diverse meteorological conditions and facilitates the analysis of seasonal variations. The specific weather station under investigation is positioned at longitude 32.0580 and latitude 34.7588, with an elevation of 10 meters above sea level. This station, situated approximately 100 meters from the shoreline, serves as a crucial data source for understanding local climate patterns.
Rain Intensity Calculation
Rain intensity measurements were derived by capturing the highest recorded value within each 10-minute interval for each year annual-maximum-series (AMS). To standardize the results, the collected data were then normalized to intensity units, expressed in millimeters per hour. This approach ensures a consistent and comparable representation of rain intensity across the studied period.
Temperature Data Processing
The temperature dataset includes average, maximum, and minimum values recorded at the weather station. For the purpose of this study, the primary focus is on the average temperature in a celsius unit, calculated annually. The yearly averages were computed by considering all valid temperature measurements obtained from the Israeli Meteorological Service, providing a detailed perspective on temperature variations over the 18-year winter-to-winter period (2005-2023).
Annual Maximum Series (AMS)
To provide a comprehensive overview of rain intensity trends over the 18-year winter-to-winter period (2005-2023)[Figure 1], we examine the collected data. The following graph illustrates the yearly variations in rain intensity, expressed in millimeters per hour.

Figure 1: rain intensity observed data against the winter occoured
This graph visually represents the fluctuations in rain intensity across the studied period.
The exploration of maximum rain intensity unveils compelling insights into the dynamics of extreme rain events over the past 18 years. In the latter half of the studied period, particularly in the last 8 years (2015-2023), these high-intensity rain events recur more frequently. The recurrence of such extreme events signals a shift in local precipitation patterns, suggesting an intensified propensity for severe weather conditions. This observation holds paramount implications for hydrological resilience and infrastructure planning, as the increased frequency of high-intensity rain events in recent years demands heightened preparedness and adaptive strategies.
Frequency of Extreme Events
The plotting-position method (method explained in the previous article [Link]), commonly employed in hydrology, allows us to assess the frequency of extreme rain events [Figure 2]. By plotting the exceedance probability against the ranked rain intensity values sorted from largest to smallest, we gain valuable insights into the distribution of extreme events over the entire dataset.
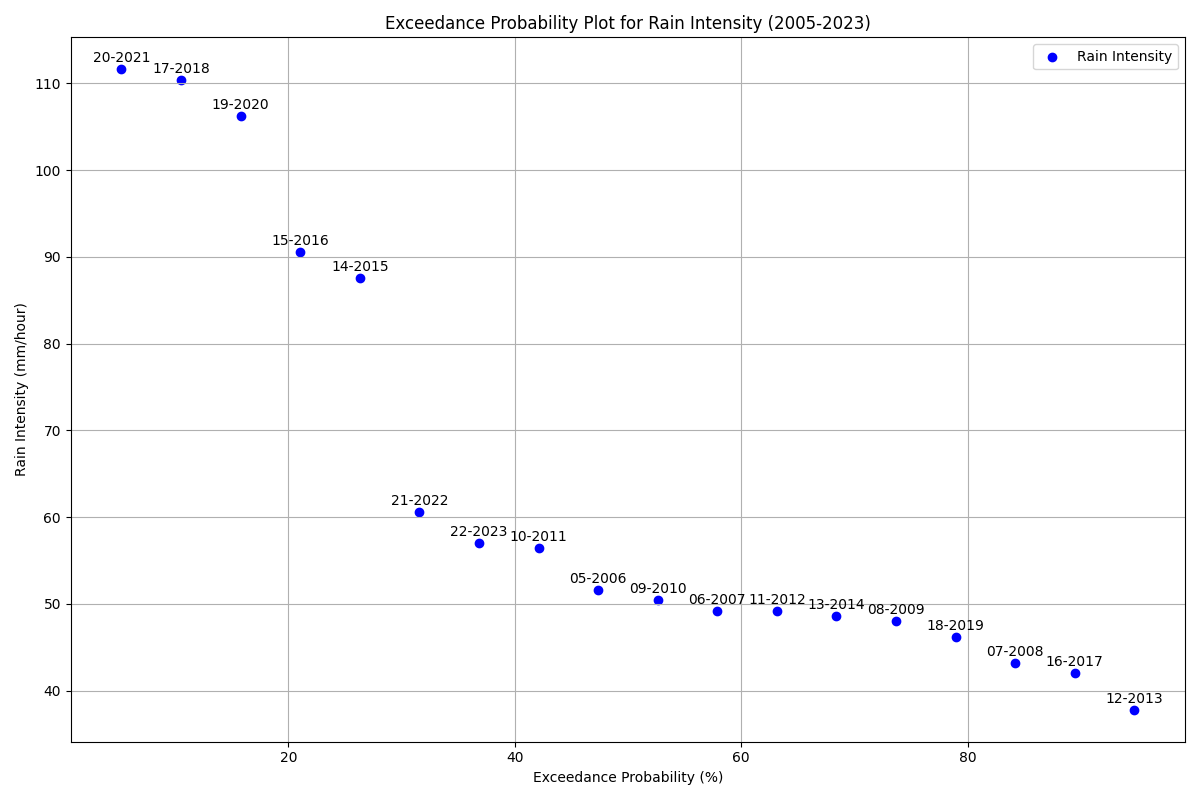
Figure 2: rain intensity observed data vs the exceednace probability
Temperature Trends
Over the 18-year period from 2005 to 2023, I analyzed the annual average temperature data [Figure 3]. The dataset encapsulates the essence of seasonal fluctuations, offering a comprehensive portrayal of temperature variations. In this section, we delve into the temperature trends to uncover potential shifts or patterns that could contribute to a deeper comprehension of the climate dynamics in our study area.

Figure 3: Annual Average temperature from 2005 to 2023
The annual average temperature trends encapsulate a narrative of climatic dynamics, offering crucial insights into the evolving thermal patterns from 2005 to 2023. A glance at the line chart reveals notable fluctuations, with distinctive peaks observed in the years 2015-2016, 2017-2018, and 2020-2021. These peaks denote periods of elevated temperatures, signaling potential climatic anomalies that warrant closer scrutiny. The year 2017-2018, in particular, emerges as a pivotal period characterized by a substantial spike in average temperatures. Further analysis is crucial to discern whether these peaks represent isolated incidents or indicative of a sustained warming trend. The temperature trends, as depicted in the graph, beckon a deeper investigation into the factors influencing these variations, be it natural climate oscillations or the potential footprint of anthropogenic influences.
Temperature Anomalies
Our exploration into temperature anomalies unfolds a nuanced narrative, unveiling deviations from the established baseline average of 21.59°C from the annual average temperature values which is the average temperature from the raw data. The calculated temperature anomalies for each year reflect the deviation of annual average temperatures from this baseline. Negative anomalies, such as those observed in 2005-2006 and 2006-2007, denote periods of cooler temperatures, while positive anomalies, exemplified in 2015-2016 and 2017-2018, signify warmer climatic conditions. [Figure 4]
Results:
- Baseline Average: 21.59°C
- Temperature Anomalies:
- 2005-2006: -0.67°C
- 2015-2016: 0.69°C
- 2017-2018: 0.76°C

Figure 4: the Temperature anomalies in C from 2005-2023
The negative anomaly in 2016-2017, despite the surrounding warm anomalies, underscores the importance of considering regional climate dynamics. Local factors, including ocean currents or atmospheric patterns, may contribute to occasional deviations from broader warming trends. As we peer into the undulating pattern of temperature anomalies, it becomes evident that the climate is not static. This analysis lays the groundwork for deeper investigations into the factors influencing these deviations and sets the stage for a comprehensive understanding of the evolving climate landscape.
Correlation Analysis
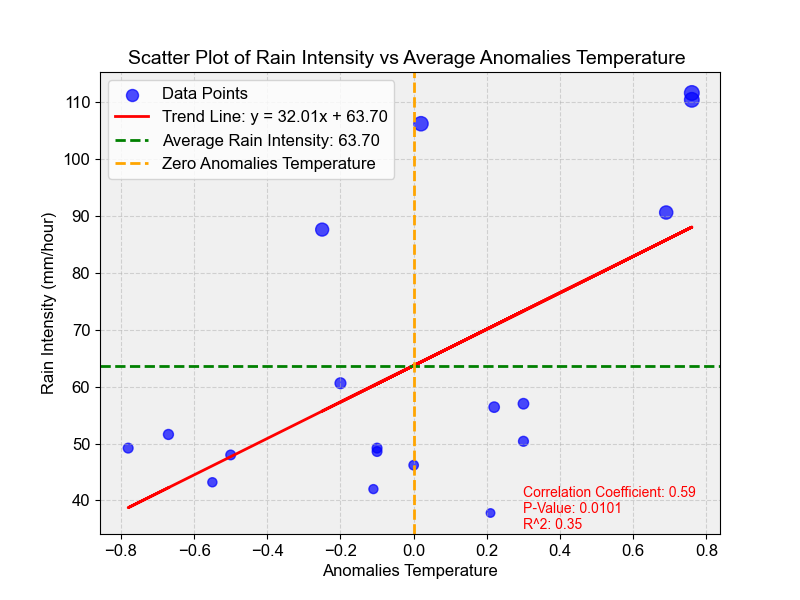
Figure 5: The correlations between the rain intensity to the average annualy anomalies temperature
The scatter plots illustrate the relationship between rain intensity events and temperature variables [Figure 5] I decided to show the corolletion between the average anomalies temperature to the rain intensity. The Pearson correlation coefficient, indicative of linear relationships, reveals a positive correlation between rain intensity and average temperatures (0.59). This suggests that as temperatures rise, there is a tendency for increased rainfall intensity.
More finding from this data is that 4 out of the 5 highest events (above 63.7 mm\hour) from the AMS are (above 90 mm\hour) occurring when the anomaly temperature is above the base-line by at least 0.56C on average. If we examine the coefficient of determination (R^2) score “the goodness of fit”, we obtain a value of 0.35 for the association between the AMS and average annual temperature. While this indicates that temperature influences our precipitation patterns, it also suggests the presence of other influential factors contributing to the variability in rainfall. These findings underscore the complexity of atmospheric processes and emphasize the necessity for comprehensive models that integrate multiple variables to improve the prediction of extreme weather events.
Conclusions
These correlations, beyond statistical values, prompt a deeper exploration into the mechanisms driving these relationships. While the findings align with broader climate change expectations, understanding the regional nuances is imperative for a comprehensive interpretation. On my next posts I will show how cities are acclimating to this climate change events in the designing and regulations for water management and flood-risk design.